
Research · September 2026 · v1.7
Time to Power: text edition
Meeting Near-Term AI Compute Demand with Existing Energized Infrastructure
By Devin Pehrson. The complete text of the published white paper is below, organized by its original page numbers. All seven original exhibits appear in the text below, with readable figure data. The page viewer above preserves the published layout.
Return to the page viewer ↑This paper presents an analysis of publicly available information, with sources cited throughout. It is not an offer of securities, investment advice, or a legal opinion. Estimates are presented at the precision the underlying data supports and no finer. Forward-looking statements reflect the author's judgment as of the publication date.
Research in brief
Three findings from Time to Power.
Summary of the September 2026 white paper, v1.7. Figures retain the dates and limits of the published research.
Power and hardware run on different timelines.
The paper reports average grid-connection lead times above four years in primary data-center markets, reaching seven years in Northern Virginia. Those estimates describe different markets and dates; they are not sequential project stages or a delivery promise.
Timelines and sources, pages 3 and 4Existing service still needs site verification.
A small facility may avoid a new transmission-level connection where existing service can accommodate the load. Utility review, service rights and local permitting still apply. Modeled headroom is not confirmed available capacity.
Facility and site requirements, page 6Flexible inference is the initial fit.
Latency-tolerant inference can be distributed across small sites. The approach uses ordinary host service without a redundant feed or backup plant, so interruptions and agreed curtailment must fit the workload. Sites remain distributed under a commercial capacity offering.
Aggregation and workload fit, page 7These are research conclusions and design assumptions. They do not establish site availability or proven deployment performance.
Page 2 of 15
Executive summary
Executive Summary
What limits the building of AI data centers has changed. The binding constraint is no longer the chip but the energized building, and the industry measures the gap in a metric it calls time to power, counted in years. This paper examines how that happened and what can be done about it.
This paper proposes that meaningful AI capacity can be assembled and installed on existing grid infrastructure. Small, relocatable, containerized facilities, each designed around a target load of 2 megawatts (MW), can aggregate small blocks of stranded power into compute blocks that today's buyers would find compelling.
The conventional paths, already slow, are getting slower. Local opposition blocked or delayed roughly $130 billion of data center projects in the first quarter of 2026 alone. Moratorium bills are pending in 14 states, and major developers have begun withdrawing projects rather than fighting for them in public. The opposition is more likely to accelerate than retreat, and each year of it makes gigawatt-scale campuses harder to site.
The alternative this paper examines is a 2 MW facility, placed singly or in multiples on one site. For flexible loads of that size, the model indicates potential capacity at already-energized sites of several hundred MW nationally at conservative assumptions and roughly two gigawatts (GW) at central ones, with the generous case several times that. That is room for many hundreds of 2 MW units across dozens of territories and underutilized industrial sites. This paper measures the resource from published national datasets and explains why it remains uncollected: no dataset records delivery headroom, and the sites are individually too small for the buyers with the most money.
This is a timing and utilization argument and does not replace the large build-out. The build-out will proceed, and capacity can be found in the margins while it does. Section 4 sets out the commercial terms that would make the model work and the ones that could break it.
Page 3 of 15
The problem: time to power
1. The Problem: Time to Power
"The biggest issue we are now having is not a compute glut, but it's power... you may actually have a bunch of chips sitting in inventory that I can't plug in. In fact, that is my problem today. It's not a supply issue of chips; it's actually the fact that I don't have warm shells to plug into." Satya Nadella, CEO, Microsoft, November 202514
1.1 Chips and power run on different timelines
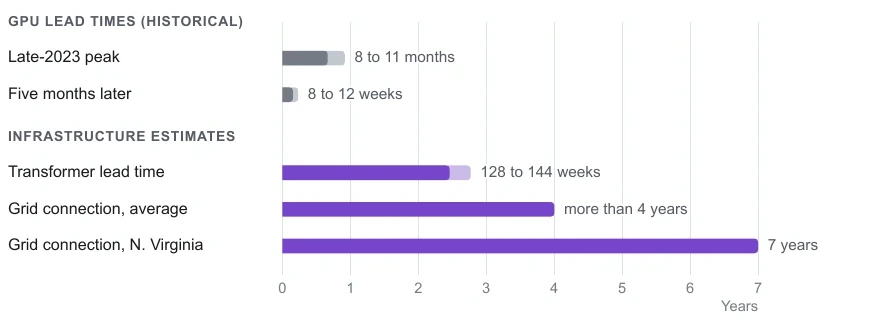
Chips are scarce too, but chip supply responds within a business cycle. GPU rental prices rose roughly 40% from their October 2025 bottom, and on-demand capacity on H100-class chips (the current fleet's workhorse) entered 2026 effectively sold out.1 Demand has kept pace, with packaging capacity sold out through 2026 by TSMC's account2 and high-bandwidth memory by SK Hynix's.3 After chip scarcity peaked in late 2023, lead times of 8 to 11 months fell to 8 to 12 weeks within five months.4 TSMC raised its 2026 capital budget to $60 to 64 billion and is roughly tripling packaging capacity from 2024 to the end of 2026,5 and Samsung is reportedly raising high-bandwidth memory capacity roughly 50% across 2026.6
Power supply has no comparable catch-up mechanism. Grid connections in primary data center markets average more than four years and reach seven in Northern Virginia.7 Developers who go around the queue by building their own generation behind the meter meet equipment queues instead. GE Vernova's gas turbine backlog and slot reservations combined stand at 116 GW. The company expects at least 125 GW under contract by the end of 2026, and its chief executive says it is on track to be "more than halfway contracted" for 2031 deliveries by then. Siemens Energy is booked into fiscal 2028.8 Transformer lead times run up to 144 weeks.9
Capacity prices show the scarcity. PJM, the nation's largest grid operator, has cleared its last three capacity auctions at the price cap approved by the Federal Energy Regulatory Commission (FERC). The latest, in July 2026, fell 6,831 MW short of the reliability requirement, and PJM's market monitor attributes about $6.3 billion of that auction's $16.4 billion in capacity market charges, roughly 38%, to data center load.10
The under-construction pipeline shrank in late 2025 for the first time since 2020, held back by permitting, zoning, and power-procurement delays. Construction rebounded in the first half of 2026, rising 24.8% to a record 7,481 MW in primary markets, but the rebound has not eased the shortage: vacancy held at a record-low 1.4%, and 80.4% of the capacity under construction was pre-leased.11 Goldman Sachs expects only 60% of next year's scheduled capacity to arrive on time, falling toward 50%.12 Ohio's commission now requires 180 days' notice before large data centers connect in AEP Ohio territory.13 Some attribute the slowdown to memory-price spikes that compress operator returns.15 That effect is real, but it acts on what a deployment earns, and a deployment still needs a building to hold it.
On its November 2025 call, CoreWeave's chief executive said "it's not a challenge for power... where the challenge is, is the powered shell," and on the same call the company lowered its 2025 revenue guidance to $5.05 to 5.15 billion because a developer's powered shells were running late.16 Berkshire Hathaway's chief executive, Greg Abel, said in September 2026, "We can produce the energy. It's... how long it would take to
Page 4 of 15
Hardware and power timelines; the cost of waiting
get the sites prepared... I continue to see that as a big constraint." NVIDIA's founder calls energy "the first principle of AI infrastructure and the binding constraint on how much intelligence the system can produce" (Exhibit 1).17
Exhibit 1 · Original page 4
Hardware and power move on different clocks
Selected reported lead times on one scale, in years. The chip figures are historical; the power figures are recent estimates.
Read figure data
| Measure | Value or relationship |
|---|---|
| GPU lead times (historical): late-2023 peak | 8 to 11 months |
| GPU lead times (historical): five months later | 8 to 12 weeks |
| Transformer lead time | 128 to 144 weeks |
| Grid connection, average | more than 4 years |
| Grid connection, N. Virginia | 7 years |
1.2 What waiting costs
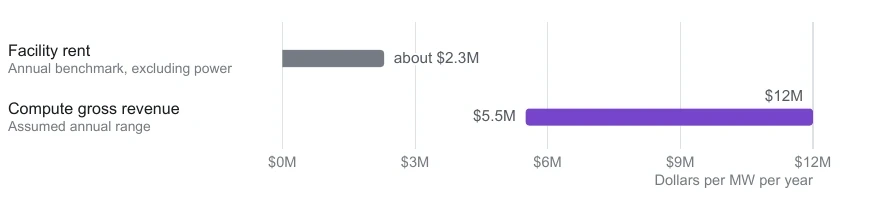
At current contract rates and assumed utilization, a megawatt of deployed critical IT (the power that reaches the racks themselves) supports on the order of $5.5 to 12 million of gross annual revenue for the compute operator, while facility rent, excluding power, runs roughly $2.3 million per megawatt-year.18 An operator holding hardware without a facility gives up that revenue, so at central assumptions a year of waiting costs roughly two to five times the annual rent on the building that would have ended the wait (Exhibit 2). The rent figure is a primary-market asking rate for retail-sized blocks. Multi-megawatt operators pay less, which widens the multiple.
Nebius prices baseline AI-cloud contracts near $12 million of annual contract value per megawatt and core long-term contracts at $20 to 25 million. It also identifies a $40 to 50 million per megawatt opportunity in short-term contracts of three to six months, a premium it attributes to contract duration.19 Its short-term buyers are labs running time-boxed jobs, so the evidence shows a market paying steeply for near-term, short-commitment capacity; it does not show that small blocks are scarce. CoreWeave raised prices roughly 25% in July 2026, with near-term capacity described as effectively sold out.20 Pricing by block size runs the other way: CBRE reports buyers paying premiums for large contiguous blocks.21 Buyers pay a premium for immediacy and, separately, for scale.
Page 5 of 15
Waiting costs and the available paths
Exhibit 2 · Original page 5
What a year of waiting puts at stake
Two different measures of one megawatt-year, on one scale.
Read figure data
| Measure | Value or relationship |
|---|---|
| Facility rent: annual benchmark, excluding power | about $2.3M per MW per year |
| Compute gross revenue: assumed annual range | $5.5M to $12M per critical IT MW per year |
1.3 The available paths
A developer who needs energized capacity has five legitimate paths, each with its own constraint.
| Path | Time profile | Capital profile | Binding constraint |
|---|---|---|---|
| Wait for a grid connection | >4 yr average; up to 7 yr in Northern Virginia7 | Deposits and studies, then heavy | The queue |
| Build a campus with dedicated generation | Multi-year; turbines reserved into 20318 | Heaviest; the developer becomes a utility developer | Equipment; permitting |
| Lease existing colocation | Months, subject to block availability | Opex-heavy; rents rising | 1.4% vacancy; 80.4% of under-construction capacity pre-leased11 |
| Acquire energized assets (miner sites, brownfield) | Deal speed: faster than a queue, slower than a lease22 | Purchase premium for embedded power rights | Scarce sellers; competition |
| Do nothing | Not applicable | Not applicable | Two to five times rent, per year (§1.2) |
The fourth path is the closest relative of the approach in §2. Buyers pay premiums for entire energized sites because the power rights come with the ground, but this works only at large single sites.
Community acceptance. One more constraint applies to every building path: whether the community will let the site be built at all. Data Center Watch counted at least 75 projects worth roughly $130 billion blocked or delayed nationally in the first quarter of 2026 alone, the largest quarterly total since tracking began. It also found moratorium bills in 14 states and opposition groups more than doubled, to 833 across 49 states. A Gallup survey in March 2026 found that 71% of Americans opposed an AI data center in their area, against 53% for a local nuclear plant; 48% strongly opposed the data center.23 The developers with the most to build are the most sensitive to that opposition. Google withdrew a $1 billion Indianapolis-area
Page 6 of 15
The approach: bring compute to power
rezoning minutes before an expected council denial, and Amazon abandoned a Maryland site beside the Calvert Cliffs nuclear plant.24 Opposition adds delay that no developer can build into a schedule, and a site that can be permitted at application can become unpermittable partway through development (Exhibit 3).
Exhibit 3 · Original page 6
Local opposition adds another source of delay
Reported US data-center opposition indicators, first quarter of 2026. The measures are not additive.

Read figure data
| Measure | Value or relationship |
|---|---|
| Project value blocked or delayed | ~$130 billion |
| Projects affected | 75+ |
| States with moratorium bills | 14 |
| Opposition groups, across 49 states | 833 |
2. The Approach: Bring Compute to Power
2.1 The facility and why its site makes it fast
This paper uses the term relocatable modular inference facility (RMIF) for a factory-built, transportable structure that converts an existing energized site into rack-ready capacity: power conditioning, cooling, fire suppression, security, and network termination, delivered as a unit. The customer installs and owns the hardware, and the RMIF supplies the facility around it. The unit is relocatable, so at contract end it moves on, leaving little permanent construction stranded. The design target is a move as short as seven to ten days, from de-energization to service at the next site. No operating record for rapid moves exists yet, and whether a facility moves is a commercial decision; the design keeps that option open.
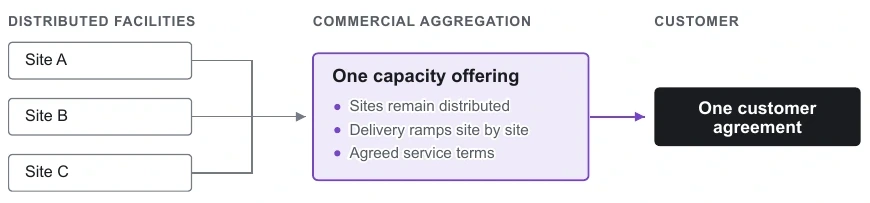
Where existing service can accommodate the load, an RMIF can avoid a new transmission-level connection. It still needs site-specific utility review, a service agreement or tariff arrangement, and local permitting. Module fabrication is estimated at three to six months, with public precedent from Duos Edge AI at the fast end.25 The model rests on three service structures: a load addition at a distribution utility, where the facility becomes a large retail customer of a municipal or cooperative system; fenceline tenancy, where it sits on a generator's own site and takes power behind its meter; and hosted placement behind an industrial customer's service, where it takes space and power inside an entitlement the host already holds. Capacity comes online block by block as sites energize, so a buyer contracts for a delivery curve with a date for each block (Exhibit 4).
Each unit is designed around a target total load of roughly 2 MW and is indifferent to what runs inside: air-cooled or liquid-cooled racks, current-generation hardware or the previous generation's. The 2 MW envelope stays constant. That indifference matters because each hardware generation runs denser than the last, and a facility design tied to one cooling regime would age with it.
Page 7 of 15
Distributed capacity and inference workloads
Exhibit 4 · Original page 7
Distributed sites, one commercial commitment
Small facilities can be offered together without becoming one physical campus.
Read figure data
| Measure | Value or relationship |
|---|---|
| Distributed facilities | Site A; Site B; Site C |
| Commercial aggregation | One capacity offering; sites remain distributed; delivery ramps site by site; agreed service terms |
| Customer | One customer agreement |
2.2 Why inference, and which kind
Training, the phase that builds a model, concentrates. It needs thousands of accelerators wired into one high-speed fabric, which favors the gigawatt campus. Inference, the phase that runs the finished model for users, can be distributed. Some inference is latency-tolerant (batch processing, asynchronous generation, evaluation) and can run wherever power is available. Other inference is proximity-driven, where being close to users is the value. Digital Realty's chief technology officer reports that more inference tokens are being produced than training tokens, and operators attribute new leasing to inference build-out.26 Groq runs 13 data centers across four continents through colocation providers, which rent out space and power in facilities they own. It targets 200 MW by end-2027, with confirmed sites at 4.5 MW and 7 MW, and Cerebras operates a 10 MW site in Oklahoma City.27 These operators assemble networks of small sites by choice, so the demand case rests on the delay economics of §1.2 and holds whether or not the colocation market serves them. The natural customers are operators like these and enterprises running their own hardware. Hyperscaler primary capacity sits outside the target market.
The tenant takes the host's ordinary service as it is, with no redundant feed or backup plant. That is a modest ask on reliability, since routine interruptions on US systems average about two hours per customer per year.29 The tenant must also be flexible, since the resource estimate in §3 assumes loads willing to ease back during the host's heaviest hours, with partial reductions of roughly a quarter of load totaling roughly 85 to 366 hours a year in Duke University's published estimate.30 These reductions are a contract feature, separate from outages, and they are what let a host say yes without building anything. Large buyers already accept this trade; Google has integrated 1 GW of demand response into its long-term energy contracts, limiting or shifting some machine learning workloads so new data centers can "connect more rapidly to local grids." Public-power and cooperative hosts, among them Colorado Springs Utilities (full interruption for up to 100 hours a year) and East Kentucky Power Cooperative, sell interruptible service to large loads. Combining the cited interruption and curtailment ranges, the offer runs at full power for roughly 96 to 99% of hours in a year and delivers roughly 99% of annual energy.29,30 Colocation offers a higher reliability standard; this product gives up some of it for an earlier date. Latency-tolerant inference fits both the reliability and flexibility terms.
Page 8 of 15
The host proposition and the resource
Several buyer situations fit the facility class: delay cost; bridge capacity while a primary campus awaits energization; previous-generation hardware displaced from premium campuses; interactive inference placed near its users; overflow beyond committed footprints; and flexible or seasonal workloads priced for interruptible service.
Others are building small modular compute. Crusoe mass-produces ~1 MW Spark modules, places its disclosed deployments beside generation that it or its partners develop, and operates the compute itself as Crusoe Cloud.31 In Crusoe's Texas campus deal, the infrastructure owner buys the modules and leases the powered shell to the compute operator.31 Duos has moved the other way. It sold its interest in the mobile turbine fleet behind its early pod deployments and is pointing its expansion at stranded power and former mining sites; its Texas pods are already on the grid.28 On the day of its second-quarter call, it announced five-year hosting agreements for 55 MW with a single compute customer at over $500 million, its largest commitment to date.28 A public company shopping for stranded power is evidence of commercial interest in this resource class. Duos still buys its ground, however, and the public record shows no facility-only lease and no relocated pod. That leaves one position open, for a facility built to move, offered as a facility only, and sitting as a tenant on power the host already has.
2.3 The host's side of the trade
A transaction needs a willing seller, and each class of host has its own arithmetic. A municipal or cooperative utility with headroom sells energy it already generates or buys to a customer whose load stays off the system peak. For a small system, a 2 MW customer running around the clock adds roughly 17 gigawatt-hours (GWh) a year of new sales, a material amount. Reusing suitable infrastructure can reduce new investment and spread fixed costs across more sales, though site-specific upgrades and approvals may still be required. An industrial host whose load has fallen but whose operations continue pays every month to reserve capacity it no longer uses, because giving up the entitlement would strand the plant. A tenant turns that standing cost into revenue. An independent or merchant generator running below its capability carries price risk on every unsold hour. A fenceline tenant paying a contracted price for a steady few MW provides revenue from a sunk asset, and that revenue does not sag with the market. All three hosts earn revenue from what is already built. Local politics are a smaller problem than in a campus fight, though still present, since many moratoria make no distinction by size.
3. The Resource: How Much Exists and Why It Remains Uncollected
3.1 The energized site is the asset
An illustrative gas-processing facility shows the difference between an energized site and capacity available to a new tenant. A reconstruction of its connected load, combining disclosed motor ratings with estimated ancillary equipment, yields roughly 60 MW of coincident electrical demand under the stated assumptions. A lower-utilization scenario yields roughly 30 MW of operating draw, leaving a modeled difference of about the same size (Exhibit 5).39 Both figures are modeled, not metered, and neither confirms utility service
Page 9 of 15
Modeled demand and the national estimate
rights. An underused plant can point to existing delivery infrastructure worth investigating, but it does not show spare power or capacity available to a new tenant; that takes site-level electrical, operating and contractual verification.
Exhibit 5 · Original page 9
An existing site: modeled demand, not verified capacity
Illustrative gas-processing reconstruction, in rounded MW under stated assumptions.

Read figure data
| Measure | Value or relationship |
|---|---|
| Modeled coincident demand | about 60 MW |
| Modeled operating draw | about 30 MW |
| Illustrative difference | about 30 MW; not verified capacity available to third parties |
3.2 The estimate
This analysis sized the resource from published national datasets: utility peak demand and sales, retired-unit records, industrial load histories, federal load data, and SEC filings on miner-to-AI conversions. The methodology was fixed before the data was pulled, and the results were recomputed internally from primary source data and adversarially reviewed. The study's two estimation paths measure overlapping but not identical populations, and they disagreed by more than the study's pre-registered tolerance. The study reports this as a failed test.32 Each lane is measured from records and discounted where the equipment's survival is uncertain. For flexible loads of the kind described in §2.2, the model indicates several hundred MW of potential capacity nationally at conservative assumptions, and roughly two GW at central ones, at already-energized sites in the 2 to 50 MW range. The data supports a range rather than a number. The utility-headroom lane counts public power and cooperative systems, where peaks are published and decisions are made locally. Headroom on investor-owned systems sits outside the count, though industrial and mining sites in those territories remain in scope. The estimate describes modeled potential, not confirmed deliverable capacity; confirming any one site requires origination work at that site.
The counted capacity falls into three lanes. A fourth sits outside the count entirely.
Municipal and cooperative utilities. The available margin is fringe delivery headroom: the difference between what a system was built to deliver and what it delivers today. It exists because distribution systems are sized for peaks they reach only a few hours a year, and many have seen decades of industrial load leave while the equipment that served it stayed in place. Federal filings count the class itself directly, recording 2,756 public power and cooperative utilities with about 237 GW of coincident peak in all (Exhibit 6).32 System peak measures the scale of the class; headroom has to be modeled, so the estimate applies Duke University's published headroom ratios to peaks measured host by host. Those ratios measure supply
Page 10 of 15
Measured hosts and modeled usable capacity
across the bulk system (US power systems average a 53% load factor), and Duke's study did not model transmission, so site origination has to confirm local delivery capacity. The host's reasons to transact are set out in §2.3.
Industrial load departure. The study measured delivery points that once served large industrial loads and now serve much less. It sized them from historical service levels in utility records and discounted them for equipment that may not have survived. This is the second-largest lane in the counted estimate, after utility headroom. Roughly half of it traces to departures more than fifteen years old, so a reader who discounts old departures should lower the central figure by roughly a tenth. The record cannot show each site's current status. Field experience indicates that the still-operating end of this class is better than the data suggests: plants still running while paying to reserve capacity they are not using. That observation comes from the author's origination work and sits outside the measured inputs.
Former mining sites and retired generators. Bitcoin miners are the one buyer class that has already brought load to stranded power at scale. Their 2024 to 2026 conversions to AI hosting, documented in SEC filings, validate the migration and record sites changing hands at premiums.32 Retired-generator sites are counted cautiously: where service was terminated outright, the resource is usually gone, and the estimate discounts accordingly.
Exhibit 6 · Original page 10
Measured hosts, modeled usable capacity
The host census is measured; what can be transacted is modeled. The second is not a conversion of the first.
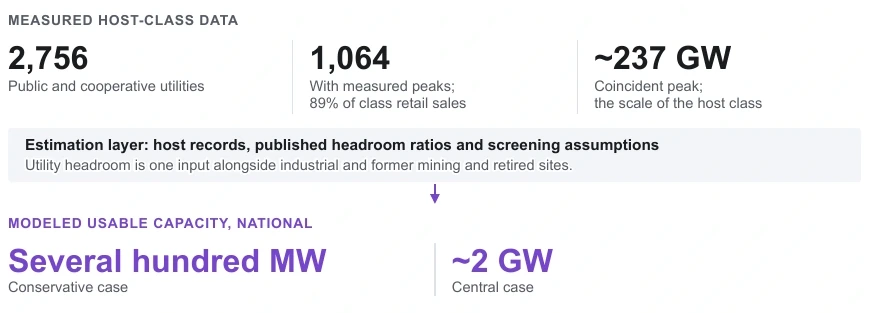
Read figure data
| Measure | Value or relationship |
|---|---|
| Measured host-class data: public and cooperative utilities | 2,756 |
| With measured peaks; 89% of class retail sales | 1,064 |
| Coincident peak; the scale of the host class | ~237 GW |
| Estimation layer | Host records, published headroom ratios and screening assumptions. Utility headroom is one input alongside industrial and former mining and retired sites. |
| Modeled usable capacity, national: conservative case | Several hundred MW |
| Modeled usable capacity, national: central case | ~2 GW |
The lane outside the count: merchant generators and independent power producers. Fenceline capacity at operating plants was deliberately excluded from the quoted range. A tenant's eligibility depends on the site, the service arrangement and applicable state and federal rules. FERC proceedings, which are not confined to PJM, address interconnection, transmission charges and service terms for co-located load. State treatment of producer-to-tenant service also varies: Utah's statute contains a conditional exclusion, while Wyoming's expressly limits its tenant-use exemption.37 Prior desk research considered five Western states; this paper cites Utah and Wyoming as examples, not as project approvals.
Page 11 of 15
Merchant hosts and aggregation
The hosts in this lane may be the most motivated of all. An operating plant has interconnection, water, staff, and a fence, and its owner carries price risk on every unsold hour (§2.3). The lane is also well populated: a screen of federal plant data identifies some 437 candidate host plants held by independent producers, with some 180 GW of nameplate running below a 50% capacity factor in the most recent reporting year (Exhibit 7).36 Much of that fleet is idle by design, since peaking units are fully employed as capacity resources and others are limited by permit or seasonal dispatch, so neither the plant count nor the nameplate figure is deliverable supply. The count measures how many hosts there are to approach.
Even a small tenant requires site-specific confirmation of electrical capacity, interconnection, cooling, permits and commercial terms. A residual share of behind-the-fence capacity does remain inside the estimate, through its host-class share factor; the underlying study does not size that share but bounds it at under a tenth of the central figure. The excluded lane may add opportunities beyond the modeled range, but it does not establish a lower bound on deliverable capacity.
Exhibit 7 · Original page 11
The merchant screen identifies hosts, not available MW
Plant counts for the full merchant screen and for the candidate subset within it: independent-producer plants below a 50% capacity factor, operating or on standby.
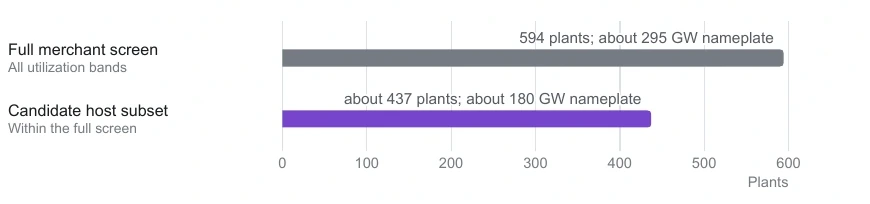
Read figure data
| Measure | Value or relationship |
|---|---|
| Full merchant screen: all utilization bands | 594 plants; about 295 GW nameplate |
| Candidate host subset: within the full screen | about 437 plants; about 180 GW nameplate |
3.3 Why the resource remains uncollected
A resource this under-priced needs an explanation. There are three, and each can be observed.
1. The data has not been collected. The host class is counted, but its headroom is not. No federal dataset records what a service entrance was built to deliver against what it draws today, so delivery-side headroom does not appear in the statistics that developers screen. The datasets in §3.2 show only where sites probably exist.
2. The sites are individually too small for the buyers with the most money. A buyer shopping for 500 MW has no way to transact for 6 MW at a rural cooperative, and the economics improve only with aggregation. The business question underneath this paper is whether one platform can collect many small sites into blocks, delivery curves, and service standards that a large buyer can contract for.
3. The one buyer class that did look took the big sites. Miners tolerate interruption and care little about connectivity, which led them to large, remote, single-site holdings, and inference revenue per megawatt-hour (MWh) can support sites that mining economics could not. The small, connectable tail
Page 12 of 15
The cost test and commercial terms
was never the miners' target, and its connectivity constraint is loosening. For latency-tolerant workloads, bonding several satellite terminals now offers a workable alternative to fiber. That setup already runs at remote mining and energy sites, though it is costly for continuous high-volume traffic and has no data-center-class deployment on the public record yet.35 Usable sites therefore extend beyond the fiber footprint.
3.4 The cost test the concept must pass
Cushman & Wakefield reports conventional US data center development at roughly $17.6 million per MW all-in, excluding the chips, up 21% since its prior guide.38 That figure sets the test any operator must pass. Facility cost per MW must be recoverable from contracted revenue within the initial term, at rates benchmarked against what the customer would otherwise pay for conventional capacity, without relying on renewal. If a site cannot pass that test, the model does not work there, however attractive the power. This paper does not publish the author's capital costs or pricing, which are deal terms. Public contracts put a number on the test. Duos's five-year hosting agreements for 55 MW of facility capacity (§2.2) are valued at over $500 million in base payments excluding electricity, about $1.8 million per MW-year. Five years at that rate comes to about $9 million per MW, below the conventional build cost, so a facility pays back inside such a term only if it costs well below $9 million per MW. The claim here is that ordinary sites can now pass the test; some sites and operators may not, and each has to pass it on its own figures.
4. The Commercial Terms to Be Resolved
The six terms below have to be resolved together, and several trade off against one another. Legal eligibility and service rights remain prerequisites.
1. Service rights firm enough to finance. Interruptible service is easier for a host to grant, and committed revenue is easier to fund. The workable middle is firm service with defined flexibility windows, and it must be documented, priced, and made compatible with the host's reliability obligations.
2. Power the customer can afford, all-in. Energy, demand charges, standby rates, and the network's own overhead must fit the hosted workload's economics. Small-system rates vary enough that this has to be checked site by site. Most large-load tariffs start well above 2 MW; across 55 tariffs reviewed by Berkeley Lab, the median threshold is 25 MW. Ohio's data center tariff uses that threshold and imposes an 85% take-or-pay minimum. Thresholds run as low as 0.3 MW, however, and some tariffs count a customer's sites together to guard against load splitting. A network caught by such a tariff could face a minimum billing demand (a median 80% of contract demand across the tariffs reviewed) and minimum terms whose median has risen to 12 years.13
3. A financing structure that closes. Asset-backed lending in this class matches the loan term to the contract term. In USD.AI's financing for Duos Edge AI, a non-recourse facility secured by the hardware and its contracts financed GPU infrastructure over 36 months against a matching customer contract that carried an $18 million prepayment.33 A customer that funds a meaningful share up front largely resolves the term-matching problem and most of the credit question.
Page 13 of 15
Commercial terms, conclusion and author
4. Reliability the customer can bank. A single-host site carries single-host exposure. What the host's commitment is worth to an enterprise customer, and what firming would cost, are per-site questions.
5. Site costs recoverable inside the term. Nonrecoverable site work must fit within the contract's protected margin. A site that needs new long-haul fiber construction fails the screen unless satellite service closes the gap (§3.3).
6. A lawful structure. Fenceline and hosted-industrial tenancy require a site-specific review of state utility law, applicable tariffs, interconnection arrangements and federal transmission-service requirements. In June 2026, FERC ordered all six regional grid operators under its jurisdiction to justify or revise their tariffs for connecting large and co-located loads. This is a dated procedural reference, and this paper does not establish eligibility for any individual project.34
The tail risk is that the model's two risks arrive together. If the AI capital cycle cools, near-term scarcity premiums are the first to go. If the large build-out lands on schedule, the margin this model fills narrows, though the schedule evidence in §1 (60% on time, falling toward 50%) suggests that is not imminent. The facility's answer to both is that it moves, but relocation and re-pricing down-market show up as depreciation, and the capital structure must be built for that. No probability is assigned to either outcome.
Conclusion
Public records establish the host classes, but the usable headroom remains modeled and requires site confirmation. It goes unclaimed because no dataset collects it and no platform has been built to gather it, and the merchant fleet sits outside the estimate entirely. A network of relocatable facilities on existing sites will not solve the national shortage, and its case does not depend on doing so. The network is designed to make existing systems more efficient, pay hosts for capacity they already carry, and put compute to work in months on infrastructure already built and paid for. What stands between the resource and the market is an aggregator that collects small sites into blocks large buyers can use. Building it requires no new technology. Where site verification and commercial terms support deployment, these margins could bring suitable workloads online years sooner than the alternative.
About the Author
Devin Pehrson is the founder and president of ArcLoom Infrastructure LLC, a company formed in 2026 to secure power at existing energized sites and provide rack-ready space for AI operators that bring their own hardware. He is the former CEO of Ute Energy and a senior finance executive with full CFO responsibilities. ArcLoom pursues the approach this paper describes.
ArcLoom Infrastructure LLC · arcloominfra.com · September 2026
Page 14 of 15
Notes 1–20
Notes Source links are clickable. Notes 22 and 39 refer to another note and author-held documentation, respectively.
1. SemiAnalysis, "The Great GPU Shortage — Rental Capacity," Apr 2, 2026. H100 one-year contract pricing: ~$1.70/GPU-hr (Oct 2025) to ~$2.35 (Mar 2026); by April 2026 the SemiAnalysis index's one-year contract range stood at $2.10– 2.70/GPU-hr. SemiAnalysis; SAH100SC index ↩
2. C.C. Wei, TSMC Annual Shareholders' Meeting, Jun 4, 2026. Quartz ↩
3. SK Hynix Q3 2025 earnings commentary (HBM essentially sold out for 2026), per Tom's Hardware. Tom's Hardware ↩
4. Tom's Hardware, Feb 16, 2024 (citing UBS) and Apr 10, 2024 (citing Digitimes). Tom's Hardware; Tom's Hardware ↩
5. TrendForce: TSMC 2026 capex $60–64B (Jul 16, 2026); CoWoS capacity ~35–40k wafers/mo (2024) toward 115–140k targeted end-2026 (Jan 2, 2025; Apr–Jun 2026). TrendForce; TrendForce ↩
6. TrendForce, Dec 30, 2025 (Samsung HBM plan, ~50% capacity increase across 2026); Samsung Q1 2026 earnings (Kim Jaejune: "significant shortages" through at least 2027). Trade reporting of a company plan. TrendForce ↩
7. JLL, 2026 Global Data Center Outlook, Jan 2026; N. Virginia figure per trade reading of JLL's market chart. JLL; Construction Owners Club ↩↩
8. GE Vernova Q2 2026 earnings (CEO Scott Strazik: taking 2031 delivery reservations), per Utility Dive, Jul 23, 2026; Siemens Energy backlog ~69 GW, booked into FY2028, per Utility Dive. GE Vernova Q2 2026 Form 8-K: gas equipment backlog 53 GW plus slot reservation agreements 63 GW = 116 GW; at least 125 GW expected under contract by year- end 2026. Utility Dive; Utility Dive; GE Vernova 8-K ↩↩
9. Wood Mackenzie, Q2 2025 transformer survey: 128-week standard, 144-week GSU lead times, specialized units to 4 years. Wood Mackenzie ↩
10. PJM 2026/27 and 2027/28 BRAs cleared at their caps ($329.17 and $333.44/MW-day); Monitoring Analytics IMM analysis (2027/28 auction: data center load ~40% of $16.4B). 2028/29 BRA results, Jul 14, 2026: cleared at the $325/MW- day cap, the third consecutive auction at the cap; 6,831 MW below the reliability requirement. Monitoring Analytics, Market Monitor Report, Jul 28, 2026: about $6.3B of $16.4B in 2028/29 capacity charges from data-center load. PJM; PJM; Monitoring Analytics; PJM; Monitoring Analytics ↩
11. CBRE, North America Data Center Trends H2 2025 (1.4% vacancy; under-construction down 6,350→5,994 MW). CBRE, North America Data Center Trends H1 2026: under construction up 24.8% to a record 7,481 MW; vacancy a record-low 1.4%; 80.4% of under-construction capacity preleased. CBRE; CBRE H1 2026 ↩↩
12. Goldman Sachs Research, May 20, 2026. Goldman Sachs ↩
13. Public Utilities Commission of Ohio: AEP Ohio data center tariff (85% take-or-pay), Jul 2025; 180-day notice order, Aug 11, 2026. Berkeley Lab and Brattle, Aug 2026: 55 tariffs; thresholds 0.3 to 150 MW, median 25 MW; aggregation provisions; minimum terms median 12 years since 2025; minimum billing demand median 80%. DCD; Berkeley Lab ↩↩
14. S. Nadella, Bg2 Pod, Nov 3, 2025, per Data Center Dynamics. DCD ↩
15. SemiAnalysis, AI Cloud TCO Model: memory cost increases (~3x in a quarter) propagating into server costs and compressing GPU-cloud returns. SemiAnalysis ↩
16. M. Intrator, CoreWeave Q3 2025 earnings call, Nov 10, 2025 (corrected transcript): the challenge is the powered shell, not power; 2025 revenue guidance $5.05B to $5.15B after a third- party developer's delay. Q2 2026 call, Aug 11, 2026 (corrected transcript). Q3 2025 transcript (PDF); Q2 2026 transcript (PDF) ↩
17. J. Huang, "AI Is a 5-Layer Cake," NVIDIA, Mar 10, 2026. G. Abel, CNBC Squawk Box transcript, Sep 2, 2026. NVIDIA; CNBC ↩
18. GPU pricing: note 1. Revenue: 600-720 H100 GPUs/MW (1.25-1.38 kW each plus 10-15% overhead) x $2.10- 2.70/GPU-hour x 8,760 hours x 50-70% assumed utilization. No fleet utilization is published; the documented case spans 22-68%. Rent: CBRE H2 2025, eight primary markets, 250- 500 kW N+1/Tier III blocks, $194.95/kW-month (~$2.34M/MW-year), published Feb 26, 2026. Wholesale rates are lower; this paper's product is non-redundant. The 2- 5x range reflects April 2026 rates and mid-band utilization; October-low pricing/low utilization yields ~0.8x. CBRE ↩
19. Nebius Group, Q2 2026 shareholder letter, Aug 12, 2026. Nebius letter (PDF) ↩
20. CoreWeave Q2 2026 earnings, per Inc. The company's CFO gave two causes on the call: near-term scarcity and pass- through of component price increases (Q2 2026 transcript, note 16). Inc. ↩
Source links from page 14
- newsletter.semianalysis.com · source 1
- gpu-index.semianalysis.com · source 2
- qz.com · source 3
- tomshardware.com · source 4
- tomshardware.com · source 5
- tomshardware.com · source 6
- trendforce.com · source 7
- trendforce.com · source 8
- trendforce.com · source 9
- jll.com · source 10
- constructionowners.com · source 11
- utilitydive.com · source 12
- utilitydive.com · source 13
- sec.gov · source 14
- woodmac.com · source 15
- pjm.com · source 16
- pjm.com · source 17
- monitoringanalytics.com · source 18
- pjm.com · source 19
- monitoringanalytics.com · source 20
- cbre.com · source 21
- cbre.com · source 22
- goldmansachs.com · source 23
- datacenterdynamics.com · source 24
- eta-publications.lbl.gov · source 25
- datacenterdynamics.com · source 26
- semianalysis.com · source 27
- s205.q4cdn.com · source 28
- s205.q4cdn.com · source 29
- blogs.nvidia.com · source 30
- cnbc.com · source 31
- cbre.com · source 32
- assets.nebius.com · source 33
- inc.com · source 34
Page 15 of 15
Notes 21–39
21. CBRE, 2026 U.S. Real Estate Market Outlook — Data Centers: neocloud and GPU-as-a-service buyers "paying premiums for scale." Data Center Frontier ↩
22. SEC filings, 2024-26, surveyed in note 32: Riot/AMD's 20- year Rockdale lease, IREN/Microsoft campus services, and outright sales. Timing is deal-specific; the comparison indicates direction, not a measured closing interval. ↩
23. Data Center Watch, Q1 2026 report; reported by NBC News, Jun 12, 2026. Gallup, Mar 2 to 18, 2026 survey, published May 13, 2026: 71% oppose a local AI data center (48% strongly); 53% oppose a local nuclear plant. Data Center Watch; NBC News; Gallup ↩
24. Withdrawals: Google, Franklin Township rezoning, Sep 22, 2025 (DCD); Amazon, Calvert County site plan, Aug 4, 2026, after a 10,000+ signature petition (Maryland Matters). ↩
25. Duos Edge AI: 90 days from order to operation; early pods paired with mobile generation, later deployments grid- powered (Hereford ISD announcement, Jan 13, 2026). Data Center Frontier; Inside HPC. ↩
26. Digital Realty CTO Chris Sharp, Q2 2026 call, Jul 23, 2026 ("more inference tokens being produced than actual training"); Iron Mountain, Q2 2026; CoreWeave managed-inference ARR ~$1M→$100M+ in the quarter (Q2 2026 transcript, note 16). Investing.com ↩
27. Groq, Jun 22, 2026: 13 data centers/four continents; target 200 MW by end-2027 (Groq). Sites: Sydney 4.5 MW (Equinix); Kamloops 7 MW (RCR Wireless); Cerebras Oklahoma City 10 MW (Data Center Frontier). ↩
28. Duos: ~300 kW grid-powered pods, no cooling water (Hereford ISD, Jan 13, 2026). Q2 call, Aug 17: ~$60M mobile- turbine-interest sale; grid-connected 5-20 MW/ former-mining targets; owned Columbus campus; interstate expansion at LOI stage. Axe Compute: five years, 55 MW, >$500M, base payments exclude electricity (Aug 17 release, GlobeNewswire). Hydra Host: 2,304 GPUs in a company- owned facility. Duos IR; Data Center Frontier. Historical 850 MW Duos/Fortress turbine fleet: GlobeNewswire. ↩
29. EIA, Today in Energy, Dec 1, 2025 (from Electric Power Annual 2024): average total interruption ~11 hours per customer in 2024 including major events; ~2 hours excluding them. EIA ↩↩
30. Norris et al., Rethinking Load Growth, Duke University Nicholas Institute, Feb 2025: 76–126 GW of curtailment- enabled headroom across the 22 largest US balancing authorities at 0.25–1.0% of annual load curtailed (≈85–366 hours/year of partial reduction); notes data centers have historically not participated in demand response. Average load factor 53% (range 43% to 61%), 2016 to 2024; transmission not modeled (Utility Dive, Feb 11, 2025). Google, Mar 19, 2026: 1 GW of demand response in long-term energy contracts. Berkeley Lab and Brattle, Electricity Rate Designs for Large Loads, Aug 2026 (Colorado Springs Utilities; East Kentucky Power Cooperative). Duke Nicholas Institute; Norris slides; Utility Dive; Google; Berkeley Lab ↩↩
31. Crusoe: Bitcoin sale to NYDIG, Mar 2025 (CNBC); Spark factory, Brighton, CO (Crusoe); Energy Vault's Snyder campus buys ten Spark units and leases powered shells to Crusoe Cloud, 8 MW initially (BusinessWire). ↩
32. Datasets: EIA-861; EIA-860M; EPA GHGRP, industrial panel 2010-23; FERC Form 714; SEC miner-to-AI filings, 2024-26. Estimator fixed before collection, amendments logged; internally recomputed from primary data/adversarially reviewed. ~75% of the central estimate derives from Duke headroom ratios (note 30): host peaks are measured, headroom modeled. The first two-path test failed its pre- registered factor-of-three tolerance. ↩↩↩
33. USD.AI $98.1M non-recourse debt facility to Duos Edge AI, 36-month term (PR Newswire), matched to a ~$176M 36- month customer contract with an $18M prepayment (Duos 8- K). ↩
34. FERC: December 18, 2025 PJM order, 193 FERC ¶61,217; April 16, 2026 compliance order, 195 FERC ¶61,030. PJM filed further compliance on May 18, 2026 (ER26-1088-001). FERC also instituted a CAISO large-load and co-location proceeding on June 18, 2026 (EL26-71-000, 195 FERC ¶61,214). June 18, 2026 show-cause orders EL26-67 to EL26-72 (McGuireWoods). Dated procedural references, not a statement of current disposition of every related docket. ↩
35. Peplink SpeedFusion multi-Starlink bonding (~220 Mbps per terminal, bonded to ~1 Gbps), deployed at remote mining and energy sites: Peplink. Speeds/latency: Business.org. Data- cap economics: pricing guide. ↩
36. EIA-860 (2024) joined to EIA-923 generation (2023-25): thermal/hydro plant groups ≥25 MW, operating/standby/idled; plant-technology capacity factors and combined-cycle blocks banded. IPP operating/standby subset below 50% CF: ~437 plants/~180 GW. Full merchant screen: 594 plants/295 GW; all-ownership below-50% screen: ~560 GW. Nameplate and host counts, not deliverable energy. Demand comparison: note 12. EIA-860; EIA-923. ↩
37. Statutory text, not a project eligibility determination: Utah Code §54-2-1(10)(b)(ii) conditionally excludes specified producer/tenant use from the definition of electrical corporation, with no sale to the public generally. Wyoming §37-1-101(a)(vi)(H)(VI) excludes metered/direct sales of utility commodities to tenants from its tenant-use exemption. Neither provision establishes eligibility for a particular arrangement. ↩
38. Cushman & Wakefield, 2026 Data Center Development Cost Guide, Aug 17, 2026: greenfield land, power, sitework, design and contingency; excludes GPUs/chips. Costs up 21% per MW since the prior guide. Cushman & Wakefield. ↩
39. Anonymous gas-processing illustration. Disclosed motor ratings are combined with estimated ancillary equipment and assumed operating conditions; supporting reconstruction held by the author. Approximately 66.6 MW connected demand × 0.90 coincidence gives 59.9 MW; modeled operating draw is 30.9 MW, leaving a 29.0 MW arithmetic difference. Rounded chart values are scenarios, not metered demand, confirmed service rights or capacity verified as available to third parties. ↩
Source links from page 15
- datacenterfrontier.com · source 1
- datacenterwatch.org · source 2
- nbcnews.com · source 3
- news.gallup.com · source 4
- datacenterdynamics.com · source 5
- marylandmatters.org · source 6
- datacenterfrontier.com · source 7
- insidehpc.com · source 8
- investing.com · source 9
- groq.com · source 10
- newsroom.equinix.com · source 11
- rcrwireless.com · source 12
- datacenterfrontier.com · source 13
- globenewswire.com · source 14
- ir.duostechnologies.com · source 15
- globenewswire.com · source 16
- eia.gov · source 17
- nicholasinstitute.duke.edu · source 18
- iso-ne.com · source 19
- utilitydive.com · source 20
- blog.google · source 21
- eta-publications.lbl.gov · source 22
- cnbc.com · source 23
- crusoe.ai · source 24
- businesswire.com · source 25
- eia.gov · source 26
- eia.gov · source 27
- epa.gov · source 28
- ferc.gov · source 29
- prnewswire.com · source 30
- sec.gov · source 31
- ferc.gov · source 32
- caiso.com · source 33
- mcguirewoods.com · source 34
- peplink.com · source 35
- business.org · source 36
- internationalsatelliteservices.com · source 37
- eia.gov · source 38
- eia.gov · source 39
- le.utah.gov · source 40
- wyoleg.gov · source 41
- cushmanwakefield.com · source 42